Outta My Way I’m Going To Starbucks!

When Customers Become Walking Advertisements

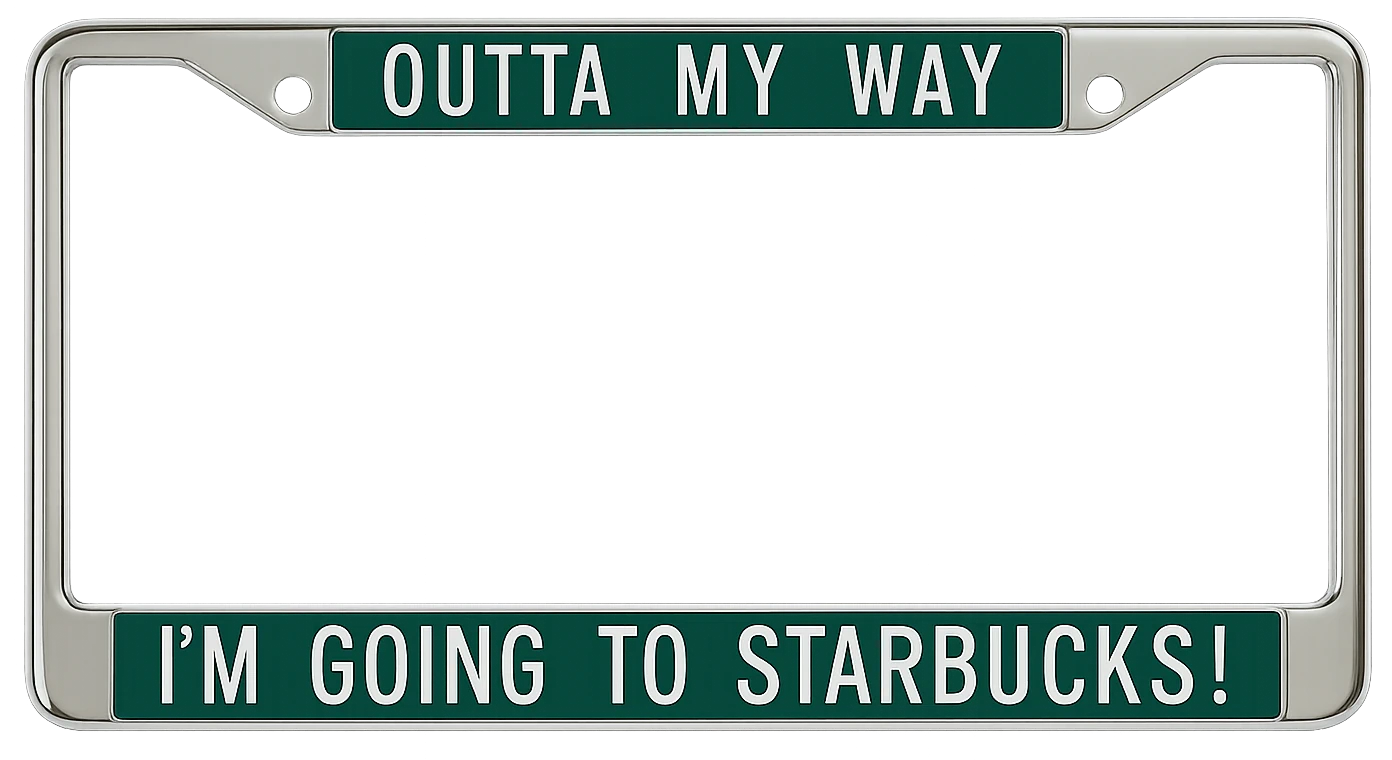
I was at a Starbucks drive-through when I noticed the license plate frame of the car in front of me. The license plate read “Outta my way, I’m going to Starbucks!”. The reason I took the picture was it was interesting to me that I was in a long line of cars for a $4 latte and the car directly in front of me loved the company so much they proudly displayed it on their license plate.

What does it say about a company when people (not companies) make and sell license plates which allow you to display your affection for a particular company?

I don’t think it is too difficult to create a company people will love and respect so much they will tell the world about it. Companies of course try to attract customers to get them in their door, but are some companies simply looking to get customers in the building, or are they looking to build relationships with their customers?

I think you can build a relationship with your customers through your brand, transparency, serving the community it serves, customer service, quality products, and differentiating products. I think if you do any of those things to a high standard (not too difficult these days) customers will come back, and they may even be so passionate about your company they will tout it on their license plate.

The Recipe for Brand Loyalty

Brand Identity

Strong, recognizable, and meaningful

Transparency

Honest communication with customers

Community

Serving the local neighborhoods

Customer Service

Going above and beyond expectations

Quality Products

Consistent excellence every time

Differentiation

Standing out from competitors

Your Recipe for Success?

Is there a recipe for the success of a company? If you were to make the perfect recipe for a company you love so much you wanted to share it with the world, what would it consist of in your opinion?

Join the Conversation

What brands have you felt so passionately about that you’ve promoted them beyond just being a customer? What did those companies do to earn that loyalty?

Data Visualization of The State of The Internet

A statistical snapshot of our digital world at the dawn of the social media era

The video goes quick so I jotted down the numbers below for us to analyze. Here are some interesting facts about the state of the Internet in 2009, which provide a fascinating snapshot of the digital landscape just as social media was beginning to dominate online activity.

Looking at these statistics from today’s perspective offers a remarkable glimpse into how rapidly the internet has evolved. From Facebook’s rise to dominance to the explosion of video content and mobile usage, these numbers capture a pivotal moment in the internet’s history—a time when digital communication was transforming from text-based interactions to the rich multimedia ecosystem we now take for granted.

Global Internet Users: The Digital Divide

As of September 2009, the internet had reached 1.73 billion users worldwide—approximately 25% of the global population at that time. However, these users were not evenly distributed across regions, highlighting significant disparities in digital access:

Asia

738,257,230

42.7% of global users

Europe

418,209,796

24.2% of global users

North America

252,908,000

14.6% of global users

Latin America/Caribbean

179,031,479

10.3% of global users

Africa

67,371,700

3.9% of global users

Oceania/Australia

20,971,700

1.2% of global users

The stark disparity between regions reflects the “digital divide” that characterized the early internet era. While North America had approximately 75% internet penetration in 2009, Africa’s penetration rate was below 7%. This inequality in access would become a major focus for development efforts in the following decade.

The Visual Internet: Photos and Video

2009 saw an explosion in visual content online, particularly through photo sharing on Facebook and video consumption through platforms like YouTube:

Photos

2.5 billion photos uploaded each month to Facebook (30 billion annually)

4 billion total photos hosted on Flickr (October 2009)

Video

12.2 billion videos per month served by YouTube in the US

924 million videos per month served by Hulu in the US

182 videos watched per month by the average internet user in the US (82% of users)

The shift toward visual media foreshadowed major changes in internet infrastructure, user behavior, and business models. As photos and videos became central to the online experience, companies would invest heavily in content delivery networks, data centers, and storage technologies to meet the growing demand.

The Dark Side: Security Concerns

As internet usage grew, so did security threats. The 2009 data reveals concerning trends in malware and compromised systems:

  • 148,000 new zombie computers created per day
  • 2.6 million malicious code threats at the start of 2009 (viruses, trojans, etc.)

The creation of nearly 150,000 zombie computers daily highlighted how the internet’s growth created new vulnerabilities. These compromised computers, forming “botnets,” could be used for distributed denial-of-service attacks, spam distribution, and other malicious activities, presenting significant challenges for cybersecurity professionals.

Reflecting on a Digital Milestone

Looking back at these 2009 statistics provides a fascinating snapshot of the internet at a pivotal moment in its evolution. Facebook was cementing its dominance, YouTube was transforming how we consume video, and the seeds of mobile internet revolution were just beginning to sprout.

Many of the trends visible in these numbers—the shift to visual content, the centralization of online activity around a few major platforms, the persistent challenges of security—would only accelerate in the following years. What’s perhaps most striking is how quickly these numbers became obsolete. Annual statistics became quarterly, then monthly, then daily as the pace of internet growth continued to accelerate.

These figures capture the internet at an inflection point—moving from its adolescence into maturity, transforming from a primarily text-based medium to a rich multimedia experience, and beginning its evolution from a desktop-centric technology to the mobile-first ecosystem we know today.

Join the Conversation

Looking at these 2009 statistics, what surprises you most about how the internet has evolved since then? Which trends from that era have continued, and which ones took unexpected turns? Share your thoughts in the comments!