Tracking three decades of American mortgage debt and its impact on the housing market
The story of U.S. residential mortgage debt is a reflection of America’s economic journey over the past three decades. From the steady growth of the 1990s through the housing bubble and crash of the 2000s to today’s post-pandemic reality, mortgage debt tells us about more than just housing—it reveals patterns in consumer behavior, economic policy, and financial resilience.
As of Q1 2025, Americans owe a staggering $12.61 trillion in mortgage debt spread across 85.10 million mortgages, making it the largest component of consumer debt at nearly 70% of all U.S. consumer debt. Understanding this massive figure—how we got here and what it means—provides crucial insights into both the housing market and the broader economy.
Let’s explore the evolution of U.S. residential mortgage debt from 1990 to 2025, examining the key trends, significant events, and current state of America’s relationship with housing debt.
Historical Trends (1990-2010)
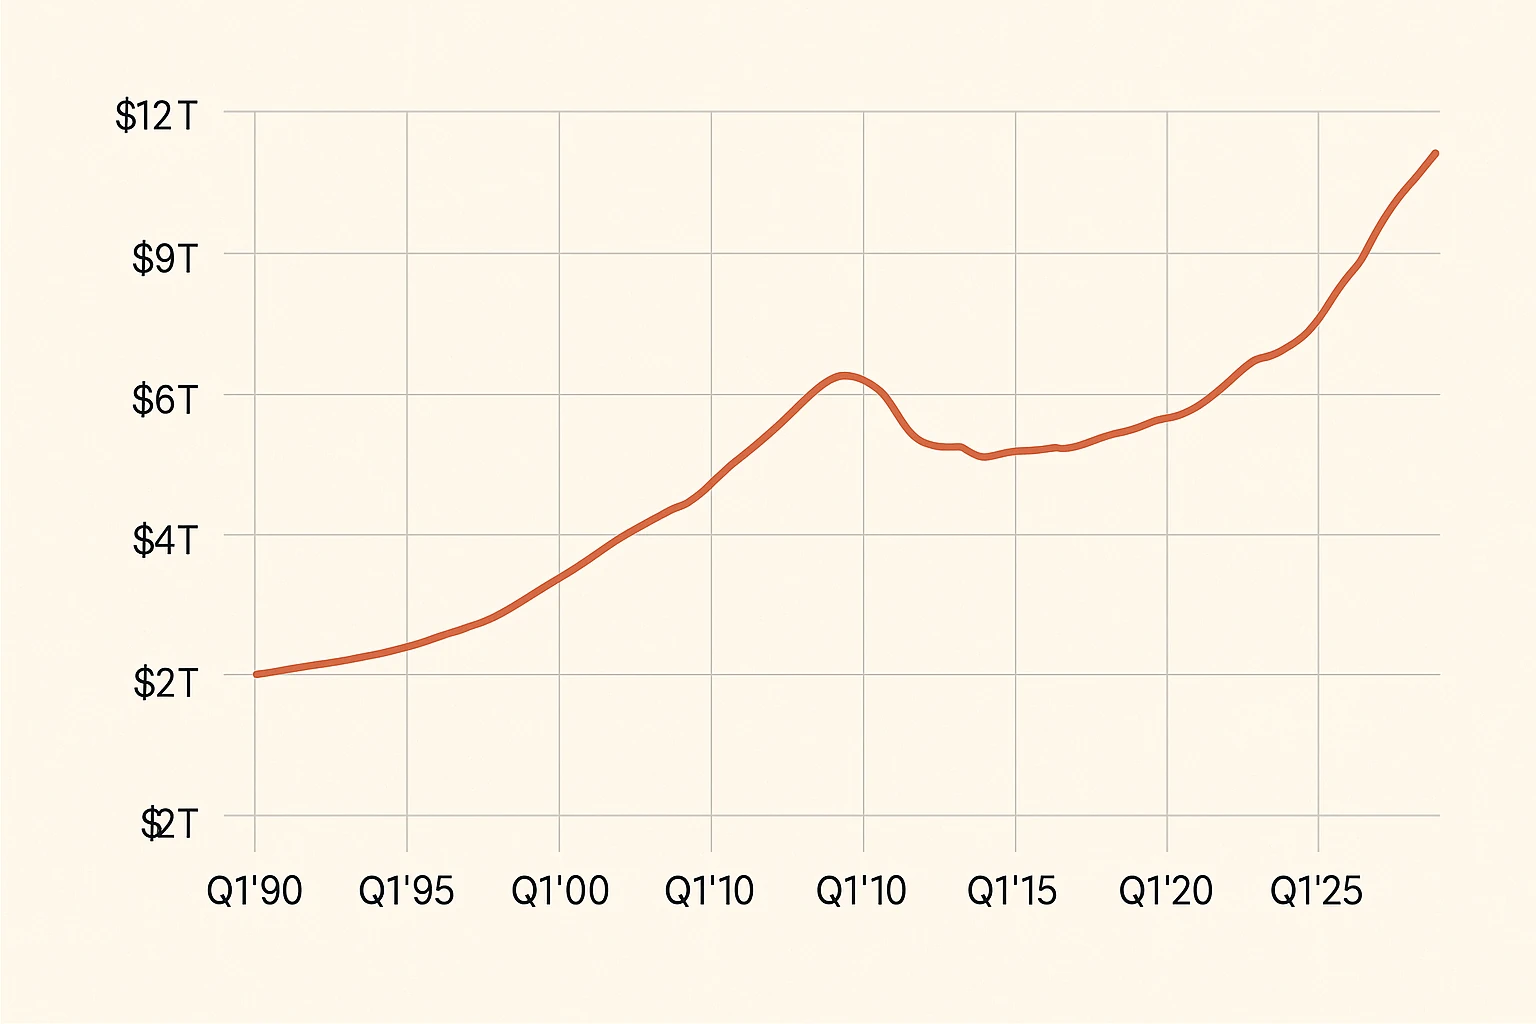
In 1990, U.S. residential mortgage debt stood at approximately $3.1 trillion. The following two decades would see this figure quadruple, driven by a combination of economic growth, housing policy, and financial innovation.
Key developments during this period included:
- 1990s Expansion: Steady growth in mortgage debt accompanied the economic prosperity of the decade, with total debt reaching $4.8 trillion by 2000
- Housing Boom (2001-2006): Expansion accelerated dramatically, with annual growth rates exceeding 13% at the peak of the housing bubble
- Subprime Lending: The mid-2000s saw a significant increase in lending to borrowers with lower credit scores, with subprime borrowing peaking at 13.6% of all originations in 2006
- 2008 Financial Crisis: Mortgage debt peaked temporarily around $10 trillion before declining for the first time in modern history
- Post-Crisis Deleveraging: Between 2008 and 2013, Americans reduced mortgage debt through a combination of foreclosures, short sales, and reduced borrowing
The housing crash revealed that mortgage debt, while fundamental to homeownership for most Americans, carries systemic risks when lending standards deteriorate and speculation drives the market. This painful lesson led to significant reforms in mortgage lending practices.
Recent Growth (2011-2025)
Following the post-crisis contraction, mortgage debt began a new growth phase around 2013 that continues today, though with different characteristics than the pre-crisis period:
- Steady Expansion (2013-2019): Mortgage debt grew at a sustainable pace, crossing the $10 trillion mark again by 2019
- Pandemic Housing Boom (2020-2022): Record-low interest rates during the COVID-19 pandemic sparked extraordinary growth in mortgage debt, adding over $3 trillion since the end of 2019
- Quality Shift: Unlike the 2000s boom, recent growth has been dominated by prime borrowers, with super-prime borrowers (credit scores above 720) accounting for 80.3% of new mortgages in 2024
- Rate Environment Shift: The transition from record-low mortgage rates (below 3%) to rates above 7% by 2023-2024 dramatically changed market dynamics
- Current State: As of Q1 2025, total residential mortgage debt stands at $12.61 trillion, continuing a slower but steady growth pattern despite higher interest rates
The pandemic-era surge in mortgage debt was unique: it occurred alongside rising home equity rather than depleting it. By Q4 2024, American households held $34.8 trillion in real estate equity, representing 72.3% of the total value of residential real estate in the U.S.
Composition of Today’s Mortgage Debt
Today’s $12.61 trillion in mortgage debt is distributed across approximately 85.10 million active mortgages, representing an average balance of $148,120 per borrower. However, this simple average masks significant variation in how mortgage debt is structured and distributed:
- Conventional Mortgages: The majority of mortgage debt is in traditional 30-year fixed-rate loans
- Adjustable-Rate Mortgages: ARMs account for just 3.5% of outstanding mortgages, down from 9.6% a decade ago
- Interest Rate Distribution: 21.9% of outstanding mortgages have interest rates below 3%, while 14.3% have rates of 6% or higher
- Additional Home Equity Debt: Americans owe an additional $396 billion on 13.16 million home equity lines of credit (HELOCs)
- Geographic Variation: Average mortgage balances vary dramatically by location, from highs exceeding $600,000 in high-cost markets to less than $200,000 in more affordable regions
The overall quality of mortgage debt has improved substantially since the 2008 crisis. The average credit score for mortgage holders now stands at 743, and serious delinquencies remain at historically low levels despite slight recent increases.
Economic Impact and Implications
Mortgage debt affects the economy in numerous ways, influencing everything from consumer spending to monetary policy:
- Wealth Effect: Higher home equity (despite high mortgage debt) has created a positive wealth effect for homeowners
- Lock-in Effect: Many homeowners with low-rate mortgages are reluctant to sell and take on new, higher-rate loans, reducing housing inventory
- First-time Buyer Challenges: The combination of high prices and higher rates has created significant affordability challenges for new entrants to the market
- Financial Stability: Despite the high absolute level of mortgage debt, the system appears more stable than in 2008 due to better underwriting standards
- Monetary Policy Sensitivity: The housing market and mortgage debt have shown high sensitivity to Federal Reserve policy changes
The current environment presents a paradox: record-high mortgage debt alongside record-high home equity and historically low delinquency rates. This suggests that while the absolute number is eye-popping, the debt may be more sustainable than raw figures suggest.
Key Health Metrics
Several metrics help us assess the health of mortgage debt beyond the simple total:
- Delinquency Rate: As of Q4 2024, only 0.70% of mortgage debt was seriously delinquent (90+ days past due), up slightly from 0.57% a year earlier but still near historic lows
- Foreclosure Activity: 174,100 new foreclosures were reported in 2024, up from 2023 but still well below pre-pandemic levels
- Underwater Mortgages: Only 2.0% of mortgaged properties were “underwater” (owing more than the home’s value) as of Q4 2024, compared to 26.0% at the peak of the crisis in 2009
- Debt-to-Income Ratios: Mortgage payment-to-income ratios have increased with higher rates but remain below crisis-era peaks in most markets
- Equity Position: The median equity position of mortgaged homes has increased substantially, providing a buffer against market corrections
These metrics collectively suggest that while affordability is strained for new buyers, existing mortgage debt appears generally healthy despite its size.
Future Outlook
Looking ahead, several factors will influence the trajectory of U.S. residential mortgage debt:
- Interest Rate Environment: The path of mortgage rates will significantly impact both refinancing activity and purchase market dynamics
- Housing Supply: Persistent housing shortages in many markets continue to put upward pressure on prices and, consequently, loan sizes
- Demographic Shifts: Millennial household formation and Baby Boomer housing transitions will influence demand patterns
- Policy Considerations: Housing affordability concerns may lead to policy interventions affecting the mortgage market
- Economic Conditions: The overall health of the economy, including employment levels and wage growth, will impact both new borrowing and repayment of existing debt
While total residential mortgage debt will likely continue growing in absolute terms, the quality and distribution of that debt will be more important factors in determining its impact on individual households and the broader economy.
Conclusion: Beyond the Headline Number
The $12.61 trillion in U.S. residential mortgage debt represents more than just a financial obligation—it reflects the American dream of homeownership and the complex system that has evolved to finance it. From $3.1 trillion in 1990 to today’s figure, the growth has been dramatic but not linear, with important lessons learned along the way.
What makes the current environment unique is the combination of historically high debt levels with strong equity positions and relatively healthy credit metrics. This suggests that while the absolute number is attention-grabbing, the context matters tremendously.
As we look to the future, the sustainability of mortgage debt will depend less on the total amount and more on how it’s distributed, how it’s financed, and how it relates to the underlying value of the housing stock. These nuances are crucial for policymakers, market participants, and individual homeowners alike as they navigate America’s complex relationship with housing debt.
Join the Conversation
How has mortgage debt affected your perspective on homeownership? Do you view it primarily as a financial burden or a wealth-building tool? Share your thoughts in the comments below!